
SQA-Software is the Windows software for the SprayQuantAI® measurement probes LSS1 and LSS2. It combines spray monitoring and spray analysis in one program: Monitoring shows droplet rate, droplet size and droplet velocity over time and evaluates them against limits; Analysis evaluates individual droplets with size and velocity distributions and characteristic values. A built-in simulation lets you try out all functions without a measuring device.
- Version: SQA-Software 1.0.10
- System: Windows 10 (build 19041 or later) or Windows 11, x64
- Measurement probes: LSS1; support for measurements with LSS2 will follow
- Simulation Mode: all functions can be tested without a measurement probe – see Test in Simulation Mode
- Availability: Microsoft Store – see Download
Spray Monitoring
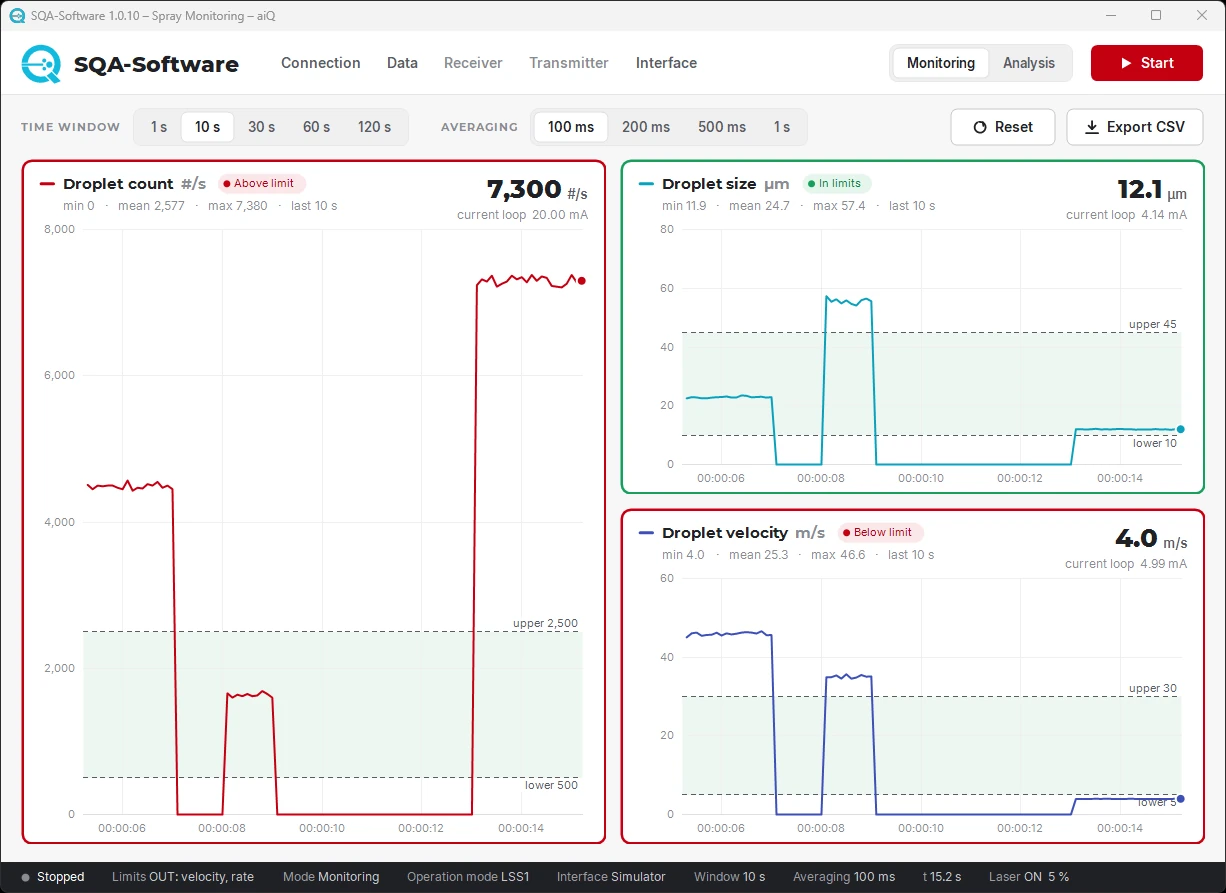
In the Monitoring view, three charts show the process over time: the droplet rate in droplets per second, the droplet size in µm and the droplet velocity in m/s. The large number on each chart is the latest averaged value; minimum, mean and maximum summarize the visible time window.
- Time window and averaging: 1 to 120 s visible time span; averaging from 100 ms to 1 s – shorter shows fast changes, longer smooths the curves.
- Limit monitoring: a green band marks the permitted range for each quantity. The frame of each chart shows at a glance whether the latest value is within limits (green), below or above a limit (red) or whether no droplets were detected (yellow).
- Process outputs: the current values can be output as 4–20 mA signals; the corresponding current is displayed for each chart.
Spray Analysis
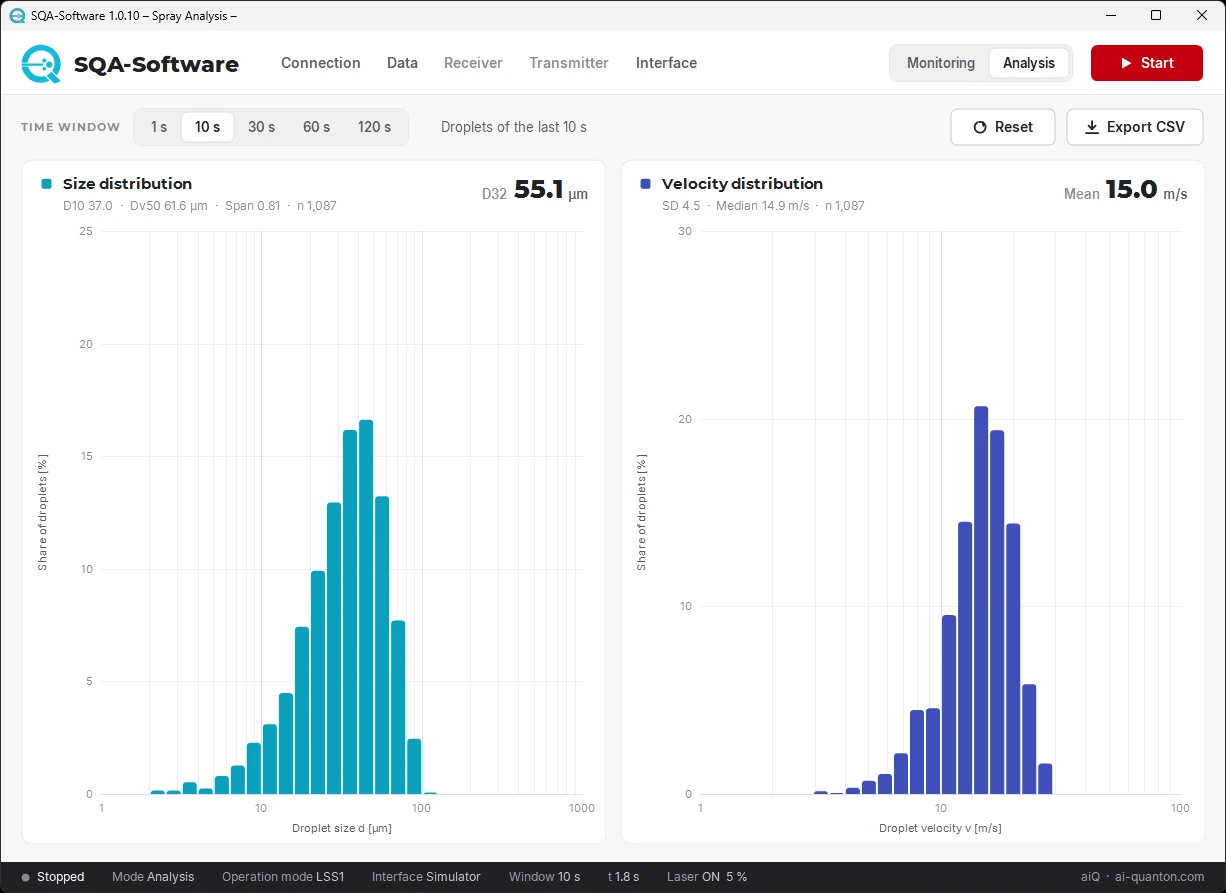
The Analysis view evaluates the individual droplets of a selectable time window – the last 1, 10, 30, 60 or 120 seconds.
- Size distribution: histogram on a logarithmic axis from 1 to 1000 µm with D32 (Sauter diameter), D10, Dv50, span and the number of droplets.
- Velocity distribution: histogram from 1 to 100 m/s with mean, standard deviation and median.
Connection, Data and Interfaces
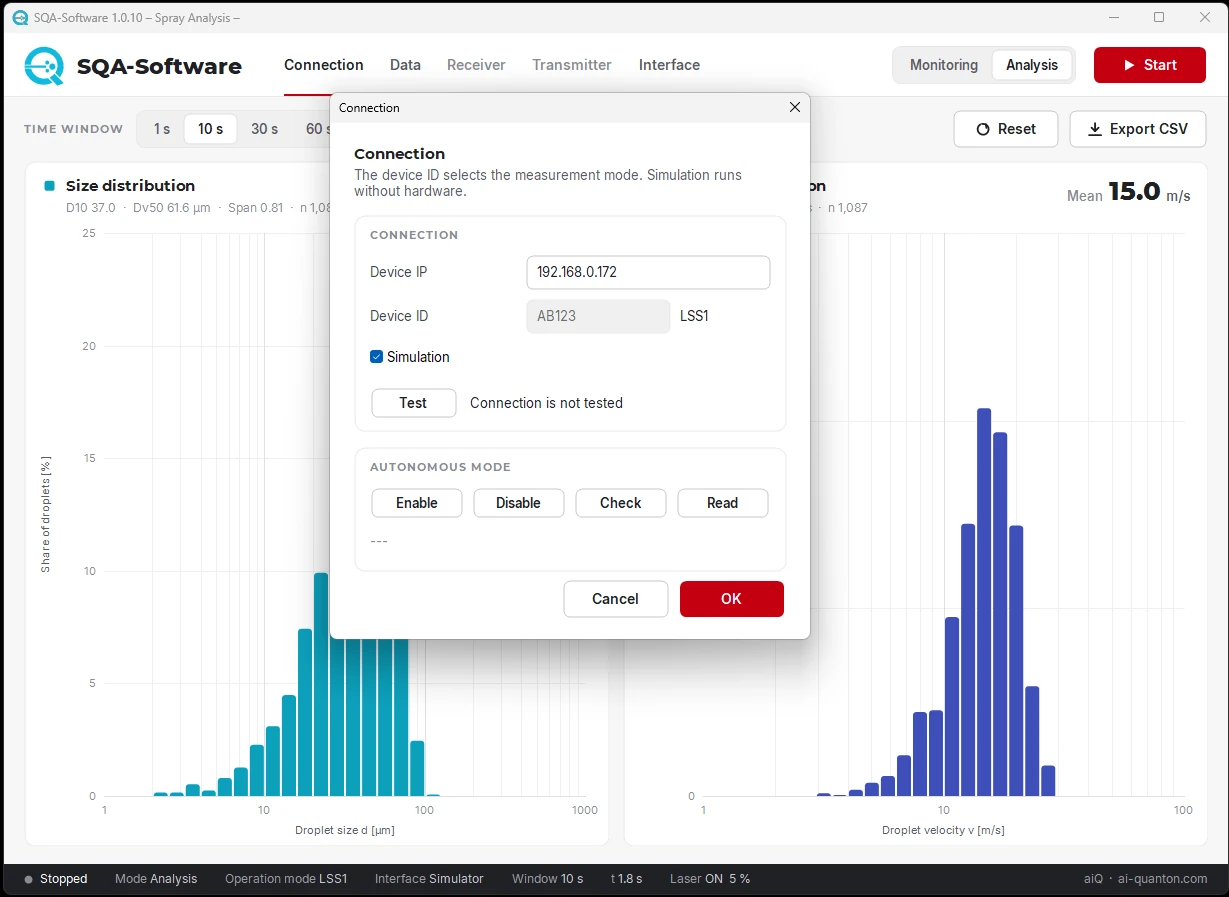
- Connection: the software connects to the measuring device via its IP address; the device ID of the probe selects the measurement mode. A connection test checks the link before the measurement starts.
- Simulation: with simulated data, users can practise operation, set limits and test exports without hardware.
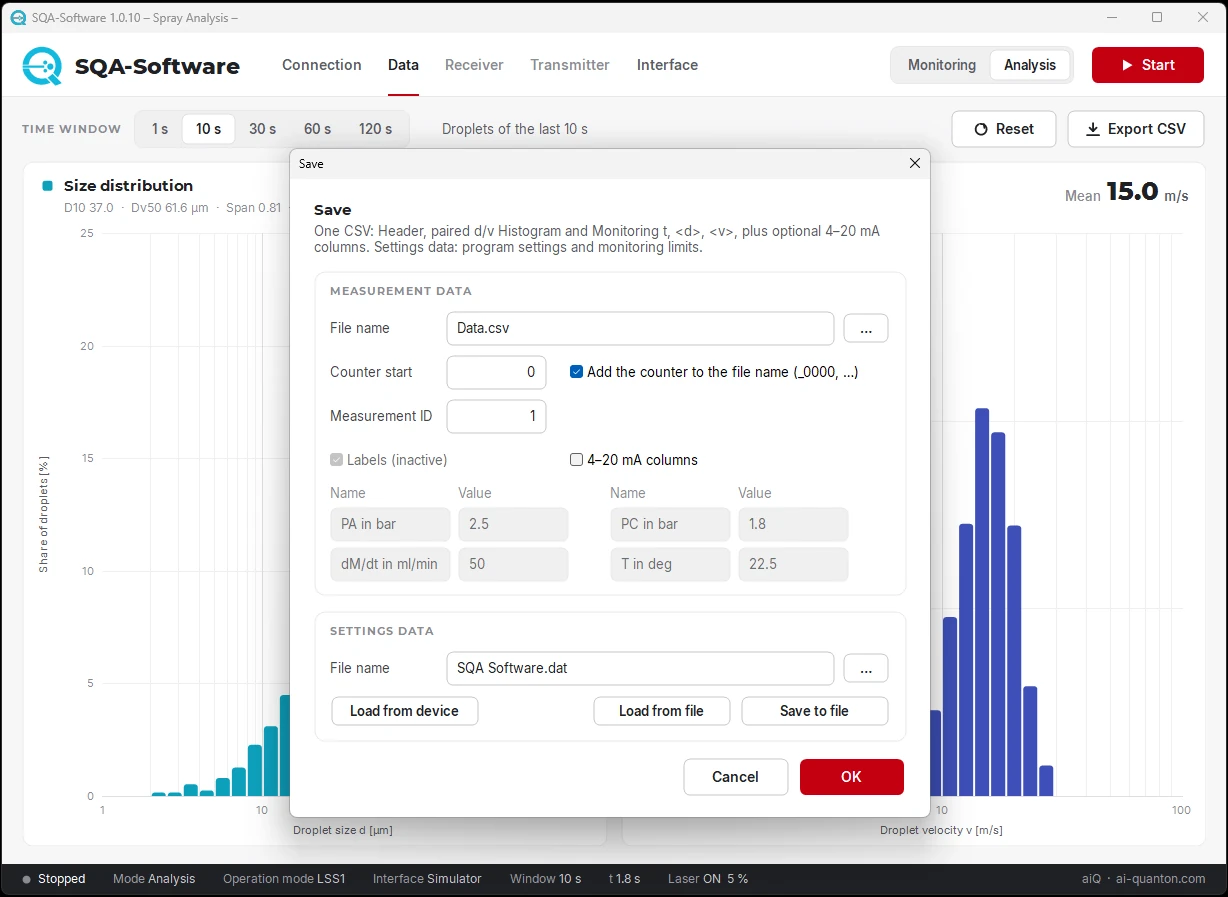
- CSV export: one CSV file contains a header, the paired size and velocity histograms and the monitoring time series with time, mean size and mean velocity – optionally with the 4–20 mA values. File counter and measurement ID identify each measurement.
- Settings profiles: all settings, including the monitoring limits, can be saved to a file, loaded from a file or read from the device.
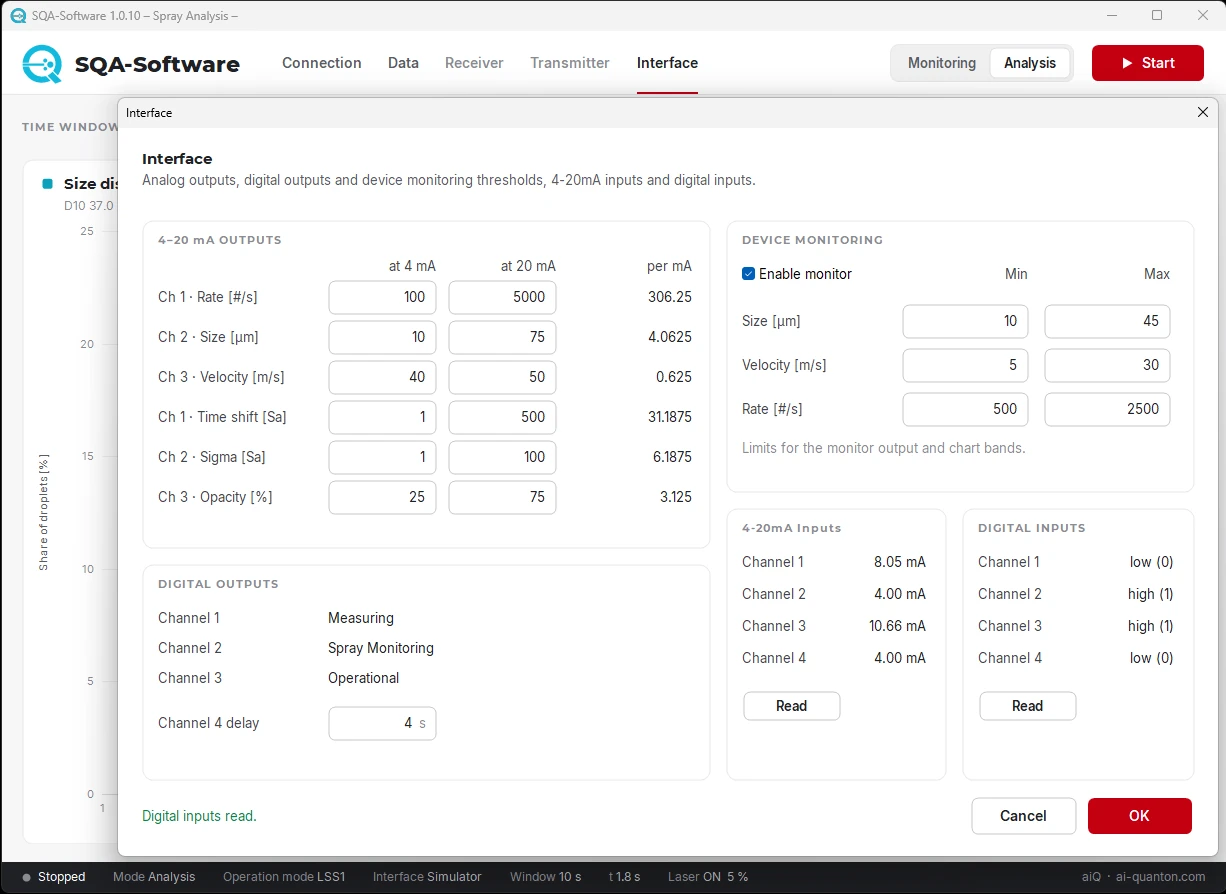
For integration into a plant, the Interface dialog sets the scaling of the 4–20 mA outputs for droplet rate, size and velocity, the digital outputs “Measuring”, “Spray Monitoring” and “Operational”, and the common monitoring limits. The 4–20 mA inputs and digital inputs of the device can be read out directly.
Download
SQA-Software is available in the Microsoft Store. Installation, first start and connecting a probe are described on the download page. For questions about measurement probes and integration, please contact us.