
In this project, we present an integration-based measurement approach for characterizing complex droplets in a spray produced by a rotary atomizer. The goal is to enhance the capabilities of the existing droplet measurement device known as the TSTOF system. The proposed extension is designed to improve both signal detection quality and the validation phase.
With the implemented integration method, droplet size and velocity can be reliably analyzed even in high-density sprays with weak light scattering signals or poor signal-to-noise ratios. Such challenging conditions frequently occur when characterizing complex droplets—for example, those containing embedded nano- or microparticles (dispersions) or forming emulsions.
Unlike traditional single-event techniques, which estimate size and velocity from individual droplet signals, the integration method evaluates a large ensemble of droplet signals. This not only increases computational efficiency but also reduces the impact of outliers in the final statistical analysis. Importantly, these advantages are achieved without compromising the accuracy of the mean and variance estimates for droplet size and velocity distributions.
To demonstrate the benefits of this new approach, measurements of a paint spray were conducted and processed using both standard routines and the integration method.
Experiment
The spray was produced using a rotary bell atomizer. To vary the measurement location, the nozzle was moved at a constant speed while the TSTOF device remained stationary. Light scattering signals were continuously recorded throughout the entire traverse of the atomizer. An external high-speed digitizer was used to capture the signals at a sampling rate of approximately 320 MS/s. Its buffer allowed for continuous data acquisition over a 50 ms window without loss, yielding around 1.6 million samples per channel.
Comparison
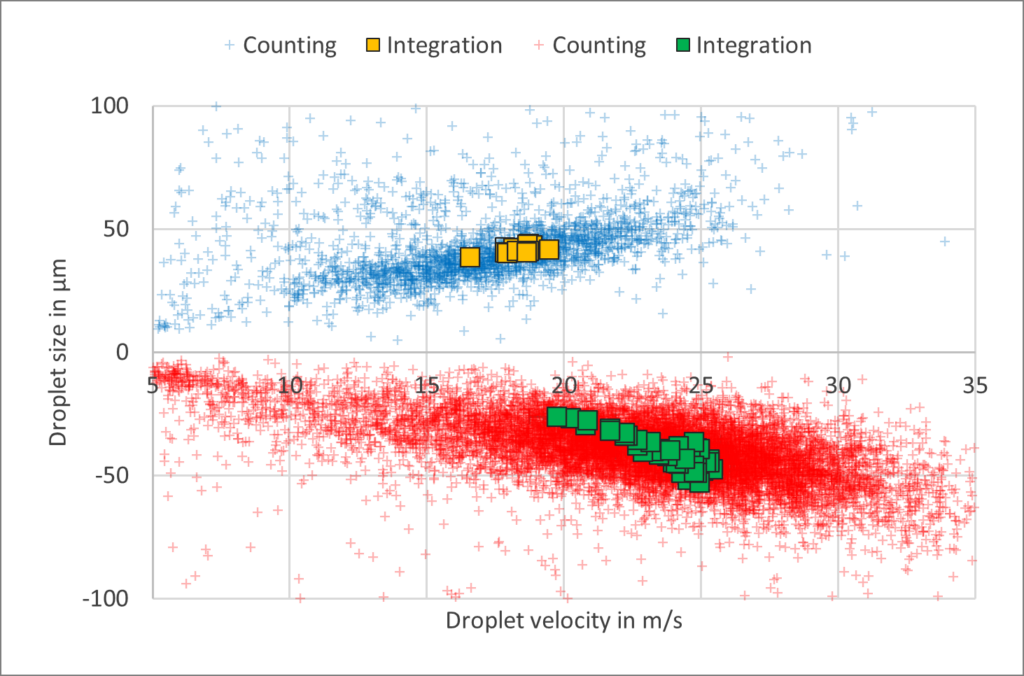
Measurement results from both the conventional and integration-based methods are compared in Figure 1. The figure plots droplet size and velocity for each detected droplet across all measurement runs as cross points. Values calculated using the integration method are highlighted with square markers.The spray contained both transparent and non-transparent droplets; the latter are represented in the figure as droplets with negative size values.